Description

In this course, you will learn the advanced pivot tables and also you will learn to create pivot tables and manipulate the data, meanwhile, you’ll be learning to import the data from Microsoft Access and Microsoft Excel into the tables, and even how to prepare the data in order to analyze like sort and filter.

And another thing you are going to learn is to create an interactive dashboard which is a very common option and also useful tools, while learning this option, you will be able to have the interactive dashboard that will help you to manage things quickly and easily.

And in the next section, you will be taught Power Pivot, Power Query, and Data Analysis, and also you will know how to discover the Power BI to create striking Data Visualization.

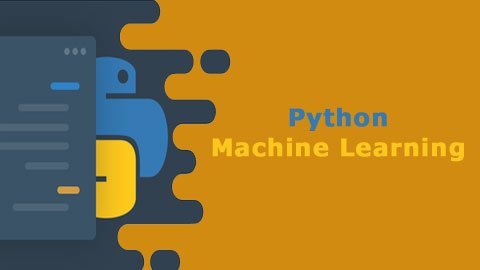
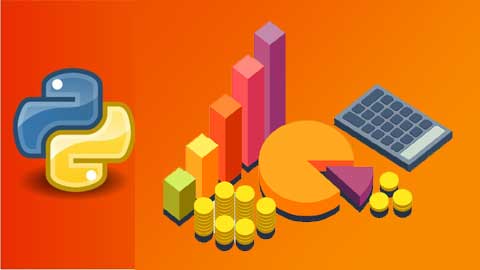
Along with that, you will also be learning python programming language so that you can write the python scripts and can automatically update data in a spreadsheet without any error.

After having this course certification, you will be a certified student of our organization.

Course Content

Total: 347 lectures
  • Introduction to Advanced Pivot Tables
  • Pivot Tables Recap
  • Importing Data from a Text File
  • Importing Data from Access
  • Cleaning Data
  • Tabular Data
  • Creating and Manipulating a Pivot Table
  • Combining Data from Multiple Worksheets
  • Grouping and Ungrouping
  • Report Layouts
  • Formatting the Error Values and Empty Cells
  • Pivot Table Styles
  • Custom Number Formatting
  • Summarizing Values
  • Show Values As
  • Advanced Sorting
  • Advanced Filtering
  • Inserting and Formatting Slicers
  • Inserting and Formatting Timelines
  • Connecting Slicers to Multiple Pivot Tables
  • Using Slicers in a Protected Workbook
  • Creating a Calculated Field
  • Creating a Calculated Item
  • Solve Order and List Formulas
  • GETPIVOTDATA
  • Creating a Pivot Chart
  • Formatting a Pivot Chart - Part 1
  • Formatting a Pivot Chart - Part 2
  • Creating a Map Chart Using Pivot Data
  • Creating a Dynamic Chart Title
  • Include a Sparkline with a Pivot Table
  • Highlighting Cell Rules
  • Graphical Conditional Formats
  • Conditional Formatting and Slicers
  • Creating an Interactive Dashboard - Part 1
  • Creating an Interactive Dashboard - Part 2
  • Updating Pivot Charts and PivotTables
  • Welcome and Overview
  • What is Power Query?
  • What is Power Pivot?
  • Exploring the Power Query Editor
  • Common Power Query Transformations
  • Editing an Existing Query
  • Importing Multiple Files from a Folder
  • Connecting to Data in Another Excel Workbook
  • Important: Checking the Location of Your Query's Source
  • Retrieving Data from the Web
  • Unpivoting Columns
  • Combining Data from Multiple Tables with Merge Queries
  • Using Merge Queries to Compare Two Tables
  • Stacking Data into One Table with Append Queries
  • Duplicating and Referencing Queries
  • Grouping and Aggregating Data
  • Adding Conditional Columns in Power Query
  • Enabling the Power Pivot Add-in
  • Understanding the Power Pivot Window
  • Creating Relationships Between Tables
  • Managing Relationships of the Model
  • Creating a Pivot Table from the Data Model
  • Hiding Fields from the Client Tools
  • Grouping Queries
  • Why Use Data Analysis Expressions (DAX)
  • Creating Calculated Columns with Data Analysis Expressions (DAX)
  • Creating the First Data Analysis Expressions (DAX) Measure
  • Using the COUNTROWS Function
  • Using the SUMX and RELATED Functions
  • Creating a Date Table in Power Pivot
  • Using the CALCULATE Function
  • Using the DIVIDE Function
  • Using the DATESYTD Function
  • Calculating the Percentage of a Total
  • Creating Pivot Tables and Pivot Charts
  • Using Slicers with Pivot Tables
  • Creating a Top 10 Pivot Table
  • Welcome and Overview
  • What Is Power BI?
  • Installing Power BI Desktop
  • Tour of Power BI Desktop
  • Exploring the Commonly Used Power BI Options
  • Importing Files from a Folder into Power BI Desktop
  • Getting Data from Excel and Text Files
  • Referencing Queries to Create Additional Lookup Tables
  • Merging Queries in Power Query
  • Preventing Queries from Loading into Power BI Desktop
  • Creating a Relationship Between Tables
  • Creating a Dynamic List of Dates
  • Creating Additional Date Columns for Analysis
  • Sorting the Month and Weekday Names Correctly
  • Marking the Table as a Date Table
  • Hiding Unnecessary Fields from the Report View
  • Calculating Total Revenue
  • Counting the Total Rows of a Table
  • Using the CALCULATE DAX Function
  • Calculating the Total Revenue for Last Year
  • Difference Compared to Last Year
  • Showing Summary Information with Cards
  • Comparing Values with Columns Charts
  • Mapping Visual to Plot Geographic Data
  • Filtering Reports with Slicers
  • Key Performance Indicator (KPI) Card to Measure Performance against a Goal
  • Line Graphs to Visualize a Trend
  • Showing Details with the Matrix
  • Top N Lists with Table Visualization
  • Adding Text Boxes and Shapes
  • Using Themes
  • Conditional Formatting
  • Editing Interactions between Visualizations
  • Filter Pane to Filter at any Level
  • Drilling through to More Detail
  • Publishing a Report to the Power BI Service
  • Different Ways to Share a Power BI Report
  • Which Side of the Divide Are You On?
  • Beginners Are Welcome
  • What Is Python?
  • Python's Comparison to Other Programming Languages
  • Examples of Python in the Workplace
  • The Easiest Place to Practice Python
  • Creating an Account Online
  • Python Data Types
  • Strings
  • Integers
  • Floats
  • Boolean
  • Data Types Exercise
  • What are Built-In Functions?
  • Where to Look for the Built-In Functions?
  • Most Common Built-In Functions
  • Built-In Functions Exercise
  • Variables and Functions
  • Storing Values as Variables
  • Comparing Variables with Operators
  • Basic Expressions
  • Functions
  • Commenting
  • Variables and Functions Exercise
  • What Is an Error?
  • Reading a Stack Trace
  • Print Function
  • Try and Except
  • You Are Not Alone
  • Errors Exercise
  • Python Keywords
  • Common Keywords
  • Global Keywords
  • Keywords Exercise
  • Basic Logic
  • Syntax and Inline Evaluation
  • Value Evaluation
  • Complex If-Else Statements
  • If-Else Exercises
  • Advanced Data Types
  • Lists
  • Dictionaries
  • Looping: Lists
  • Looping: Dictionaries
  • Advanced Data Exercise
  • Python Modules
  • Python Built-In Modules
  • Importing Modules
  • Python Environments
  • Installing Python on Mac
  • Installing Python on Windows
  • Installing Python on Integrated Development Environments (IDEs)
  • Installing Python on Integrated Development and Learning Environment (IDLE)
  • Managing Files and Folders
  • Executing Scripts
  • Pip
  • Project Introduction
  • Setting Up the Project
  • Reading and Writing to Excel Files
  • Working with Comma-Separated Values (CSV) Files
  • Dynamic File Paths
  • Transforming and Validating Transactions
  • Transferring and Saving Transactions
  • Cleaning Up the Code
  • Hardening the Script
  • Introduction
  • Alteryx Essentials
  • Data Types 101
  • Getting Started with the Alteryx Designer
  • Building a Workflow in Designer
  • The Favorites Tools
  • Data Filtering for Beginners
  • Introduction to Alteryx for Excel Users
  • Alteryx for the SQL Analyst
  • Introduction to Basic Functions - Part 1
  • Introduction to Basic Functions - Part 2
  • Introduction to Basic Functions - Part 3
  • Basic Parsing Methods
  • Basic Parsing Methods w/ Dynamic Renaming
  • Basic VLOOKUP and Append
  • Working on Multiple Fields in Alteryx
  • Build an Alteryx Workflow
  • Basic Tips and Tricks
  • Alteryx Best Practices - Visualizing Data
  • Alteryx Best Practices - Visualizing Data with Texts and Charts
  • Alteryx Best Practices - Layouts and Rendering
  • Introduction to Analytic Apps
  • Introduction to Macros
  • Intro to Data Analysis - Working Spatial Data
  • Introduction to Data Analysis - Measuring
  • Introduction to Data Analysis - Spatial Objects
  • Introduction to Analytics
  • Introduction to K-Centroid Clustering
  • Introduction to K-Nearest Neighbor
  • Introduction to Market Basket Analysis
  • Introduction to Logistic Regression Analysis
  • Introduction to Linear Regression Analysis
  • Introduction to Tree-Based Models Part 1
  • Introduction to Tree-Based Models Part 2
  • Introduction to the Course
  • What Is Qlik Sense?
  • Qlik Sense Versus QlikView
  • Different Versions of Qlik Sense
  • Exploring the Qlik Sense Interface
  • Loading Data Part 1
  • Loading Data Part 2
  • Creating and Loading Apps
  • Adding Your First Chart
  • Editing Your Visualization Part 1
  • Editing Your Visualization Part 2
  • Publishing and Sharing Apps
  • Exercise 01: Loading Data
  • Data Assets in Visualization Part 1
  • Data Assets in Visualization Part 2
  • Types of Charts and Graphs Part 1
  • Types of Charts and Graphs Part 2
  • Types of Charts and Graphs Part 3
  • Types of Charts and Graphs Part 4
  • Types of Charts and Graphs Part 5
  • Generating Insights and Analysis
  • Exercise 02: Build a Chart
  • Exercise 03: Types of Charts and Graphs
  • Aggregations
  • Functions and Expressions Part 1
  • Functions and Expressions Part 2
  • Date and Time Formatting
  • Conditional Functions
  • Data Load Script
  • Join, Keep, and Concatenate Prefixes
  • Set Analysis
  • Exercise 04: Numeric and String Functions
  • Exercise 05: Inner Join
  • Geo Analytics in Qlik Sense
  • Qlik Sense Course Conclusion
  • Welcome!
  • Why R?
  • R for Data Science
  • Preparing Workspace
  • Guide to RStudio
  • Exercise 1 - Introduction to R
  • Operations-and-Variables
  • Data Types in R
  • Coding Style
  • Comments
  • Exercise 2 - Basics of R programming
  • Vector Creation
  • Selecting Components from a Vector
  • Labeling Vector Elements
  • Calculations with Vectors
  • Base R Functions to Use with Vectors
  • Comparing Two Vectors
  • Modifying Vector Components
  • Exercise 3 - Vectors
  • Matrix Introduction and Creation
  • Matrix Metrics and Naming
  • Selecting Elements
  • Matrix Arithmetic
  • Matrices Operations
  • Matrix Modification
  • Exercise 4 - Matrices
  • Array Introduction and Creation
  • Array Similarities to Matrices
  • Other Array Operations
  • Exercise 5 - Arrays
  • List Introduction and Creation
  • List Naming
  • Selecting List Elements
  • List Manipulation
  • List Operations
  • Exercise 6 - Lists
  • Factor Introduction and Creation
  • Setting Factor Levels
  • Ordering Factors
  • Converting Factors
  • Other Considerations
  • Exercise 7 - Factors
  • Loop Introduction and Creation
  • If-Else Statements
  • For Loops
  • While Loops
  • Repeat Loops
  • Loop Comparison
  • Exercise 8 - Loops
  • Function Introduction and Creation
  • Function Arguments
  • Nested Functions
  • Global Versus Local Variables
  • Exercise 9 - Function
  • Dataframe Introduction and Creation
  • Tidyverse
  • Tibbles
  • Tidy Data
  • Dplyr and Data Transformation
  • Summarizing Dataframes
  • Exercise 10 - Dataframe
  • Introduction to Mini-Project
  • Importing Data
  • Comprehending the Dataset
  • Tidying Data
  • Grouping Time Series Analysis Data
  • Data Visualization
  • Statistical Analysis
  • Exercise 11 Mini-Project
  • Great Job and Farewell!
  • Course Introduction
  • Tableau Introduction
  • Tableau Product Suite Introduction
  • Business Intelligence Introduction
  • Exploring Tableau
  • Tableau Data Concepts
  • Connecting to Data Sources
  • Data Sources in Tableau
  • Tableau Workspace
  • Creating a New View
  • Using Multiple Data Sources
  • Exercise 1
  • Selecting a Chart Type Part 1
  • Selecting a Chart Type Part 2
  • Building a View Part 1
  • Building a View Part 2
  • Designing Callout Numbers and Tables
  • Histograms and Whisker Plots
  • Scatter Plot and Correlation Matrix
  • Spatial Charts
  • Creating a Dashboard
  • Presenting a Story
  • Publishing and Sharing a Workbook
  • Exercise 2
  • Exercise 3
  • Using Expressions in Tableau
  • Numeric Expressions and Automatic Calculations
  • String Expressions
  • Conditional Expressions
  • Analytical Functions
  • Exercise 4
  • Exercise 5

Reviews

Please login or register to review

Related Courses

Microsoft Excel

beginner

Microsoft Excel

4.4 (20)
₹1,500 ₹3,000
Certificate in Python Machine Learning

beginner

Certificate in Python Machine Learning

4.4 (20)
₹799 ₹10,200
Certificate in Python

beginner

Certificate in Python

4.4 (20)
₹799 ₹22,500
Certificate in Python for Finance

beginner

Certificate in Python for Finance

4.4 (20)
₹799 ₹8,500
Certificate in AI with Python

beginner

Certificate in AI with Python

4.4 (20)
₹799 ₹2,500
Power BI for Business Professionals

beginner

Power BI for Business Professionals

4.4 (20)
₹799 ₹20,000
Advanced Python Programming

beginner

Advanced Python Programming

4.4 (20)
₹799 ₹20,000
Advanced Excel

beginner

Advanced Excel

4.4 (20)
₹3,500 ₹15,000